[Experiment] Docker Monitoring And Metrics Exporting Solutions
Background
This post introduces 2 basic solutions about docker monitoring. And what's more, we want to dig into metrics exporting methods. In order to do some data analysis, we want to extract metrics in a usable/simple format (e.g. CSV). It's easy to query some metrics, but the tools paid less attention to export multiple metrics joined by timestamp(this can be some scenarios about data analysis, or dev daily report), we are going to build a small tools for this.
CAdvisor, InfluxDB and Grafana
\1. You have run some containers which you want to monitor
\2. Run influxdb in a container
sudo docker run -d \
-p 8083:8083 \
-p 8086:8086 \
--expose 8090 \
--expose 8099 \
--name influxsrv \
tutum/influxdb
Now you can navigate to your http://DockerIP:8083, use the credentials below to login to InfluxDB.
Username - root, Password - root
- Create the cAdvisor Database
Type into the textfield in your influxdb admin page
CREATE DATABASE "cadvisor"- Create a Retention Policy on Database "cadvisor"(optional)
This means you can specify how long your data will be stored. The following query takes7 daysas an example.
CREATE RETENTION POLICY "rp_cadvisor" ON "cadvisor" DURATION 7d REPLICATION 1 DEFAULT\3. Set up cAdvisor on your host machine
sudo docker run \
--volume=/:/rootfs:ro \
--volume=/var/run:/var/run:rw \
--volume=/sys:/sys:ro \
--volume=/var/lib/docker/:/var/lib/docker:ro \
-p 8080:8080 \
--detach=true \
--link influxsrv:influxsrv \
--name=cadvisor \
google/cadvisor:latest \
-storage_driver=influxdb \
-storage_driver_db=cadvisor \
-storage_driver_host=influxsrv:8086
After this, cadvisor will monitor all your containers including itself, and send metrics data to influxdb. You can visit http://DockerIP:8080 to see whether cadvisor works.
\4. Run Grafana to do the visualization
sudo docker run -d \
-p 3000:3000 \
-e INFLUXDB_HOST=localhost \
-e INFLUXDB_PORT=8086 \
-e INFLUXDB_NAME=cadvisor \
-e INFLUXDB_USER=root \
-e INFLUXDB_PASS=root \
--link influxsrv:influxsrv \
--name grafana \
grafana/grafana
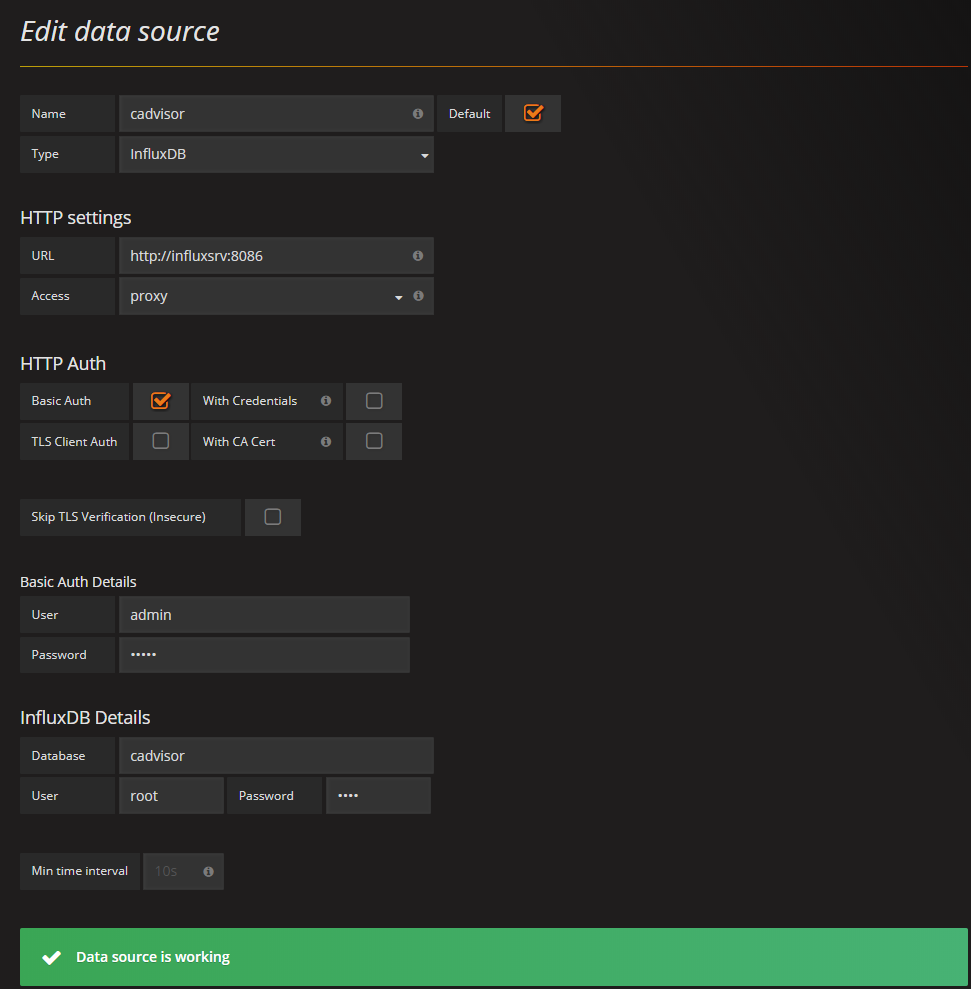
Visit http://DockerIP:3000, use username&password admin to login Grafana. Add datasource, then add a dashboard.


About Metrics Exporting
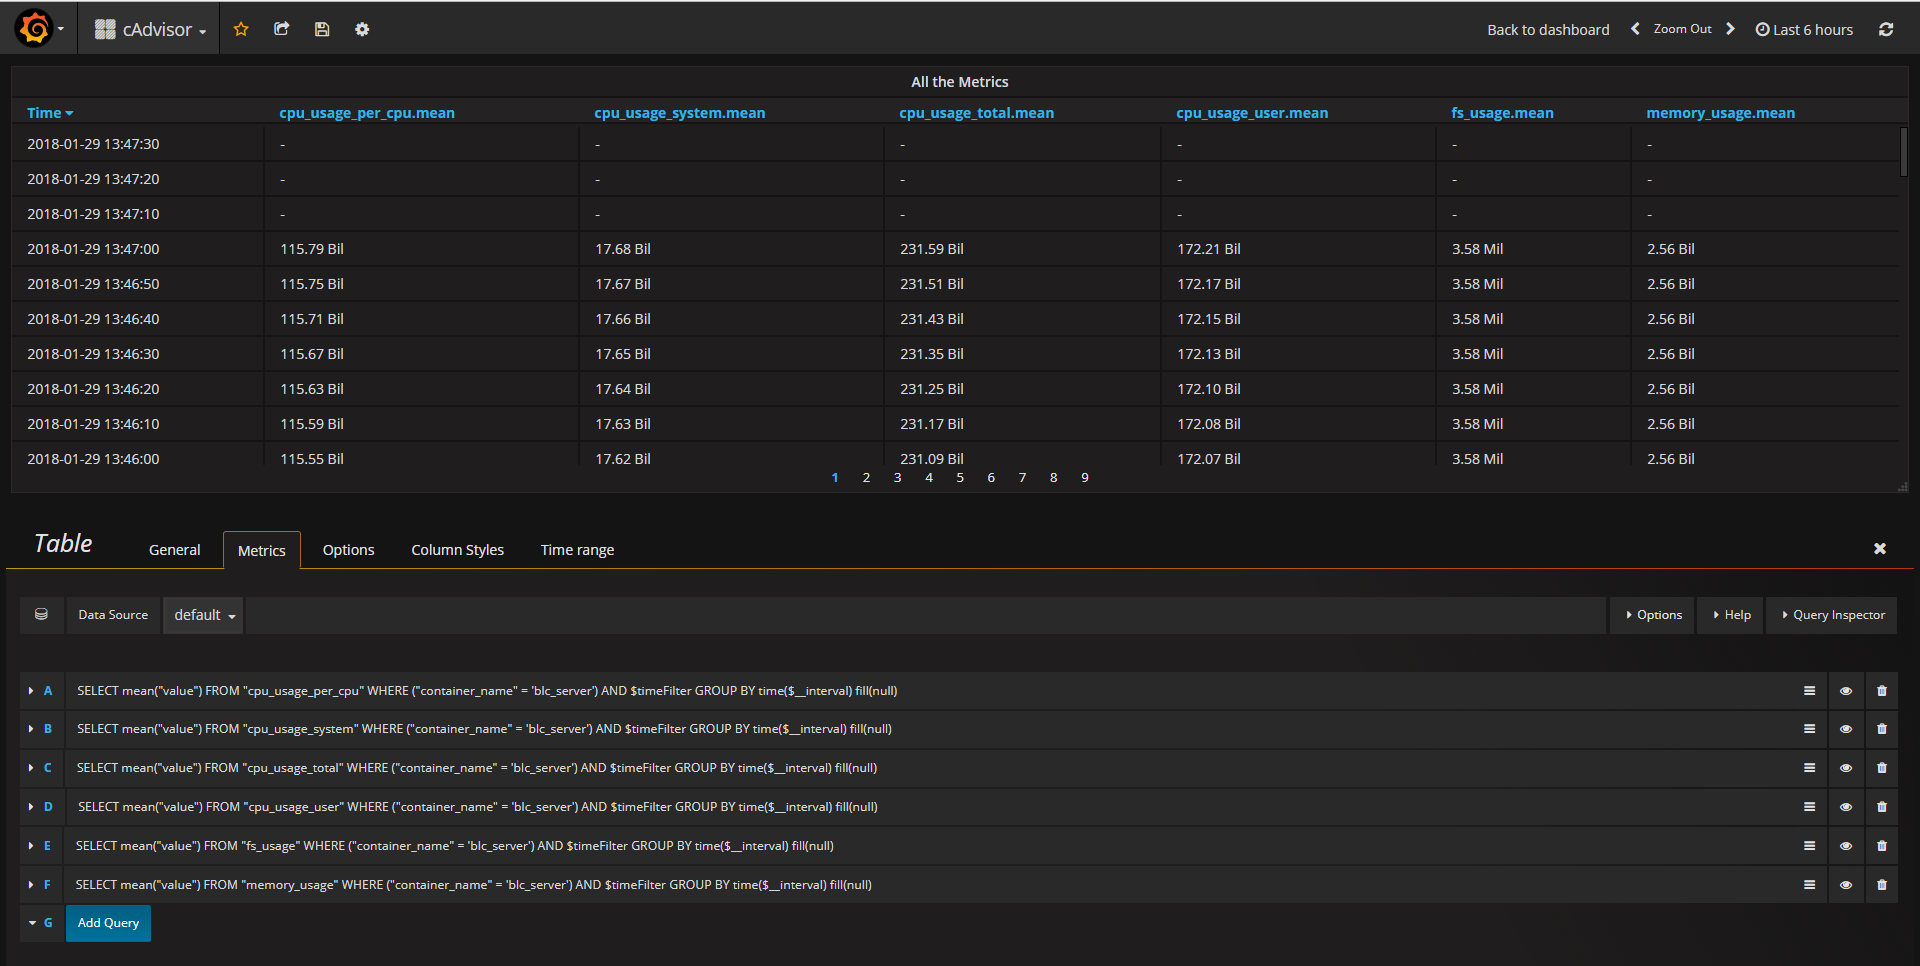
The latest version of Grafana has provided "export CSV", but you have to set up lots of queries first. Remember to set "Table Transform" in options to time series to columns, so that Grafana will fetch the metrics and join theme by timestamp. The export button is hidden in this area:

Compared to cAdvisor with Prometheus, the types of metrics are limited, only 13 metrics as following:
- cpu_usage_per_cpu
- cpu_usage_system
- cpu_usage_total
- cpu_usage_user
- fs_limit
- fs_usage
- load_average
- memory_usage
- memory_working_set
- rx_bytes
- rx_errors
- tx_bytes
- tx_errors
CAdvisor, Prometheus and Grafana
\1. You have run some containers which you want to monitor
\2. Run cadvisor in a container
sudo docker run \
--volume=/:/rootfs:ro \
--volume=/var/run:/var/run:rw \
--volume=/sys:/sys:ro \
--volume=/var/lib/docker/:/var/lib/docker:ro \
-p 8080:8080 \
--detach=true \
--name=cadvisor \
google/cadvisor:latest
\3. Run Prometheus and set up a job about fetching metrics from cAdvisor
- First of all, we touch a new configure file
 ## prometheus.yml ##

 global:
     scrape_interval:     15s # By default, scrape targets every 15 seconds.
     evaluation_interval: 15s # By default, scrape targets every 15 seconds.
         # scrape_timeout is set to the global default (10s).

         # Attach these labels to any time series or alerts when communicating with
         # external systems (federation, remote storage, Alertmanager).
     external_labels:
         monitor: 'blc-monitor'

 scrape_configs:
     - job_name: 'prometheus'
       scrape_interval: 5s
       static_configs:
           - targets: ['localhost:9090']

     - job_name: 'cadvisor'
       # Override the global default and scrape targets from this job every 5 seconds.
       scrape_interval: 5s
       static_configs:
- targets: ['cadvisor:8080']- Start Prometheus as container service, and link it to cadvisor
sudo docker run -d -p 9090:9090 \
-v ~/prometheus/prometheus.yml:/etc/prometheus/prometheus.yml \
--link cadvisor:cadvisor \
--name=prometheus \
prom/prometheus \
--config.file=/etc/prometheus/prometheus.yml
\4. Run Grafana to do the visualization
sudo docker run -d \
-p 3000:3000 \
--link prometheus:prometheus \
--name grafana \
grafana/grafana
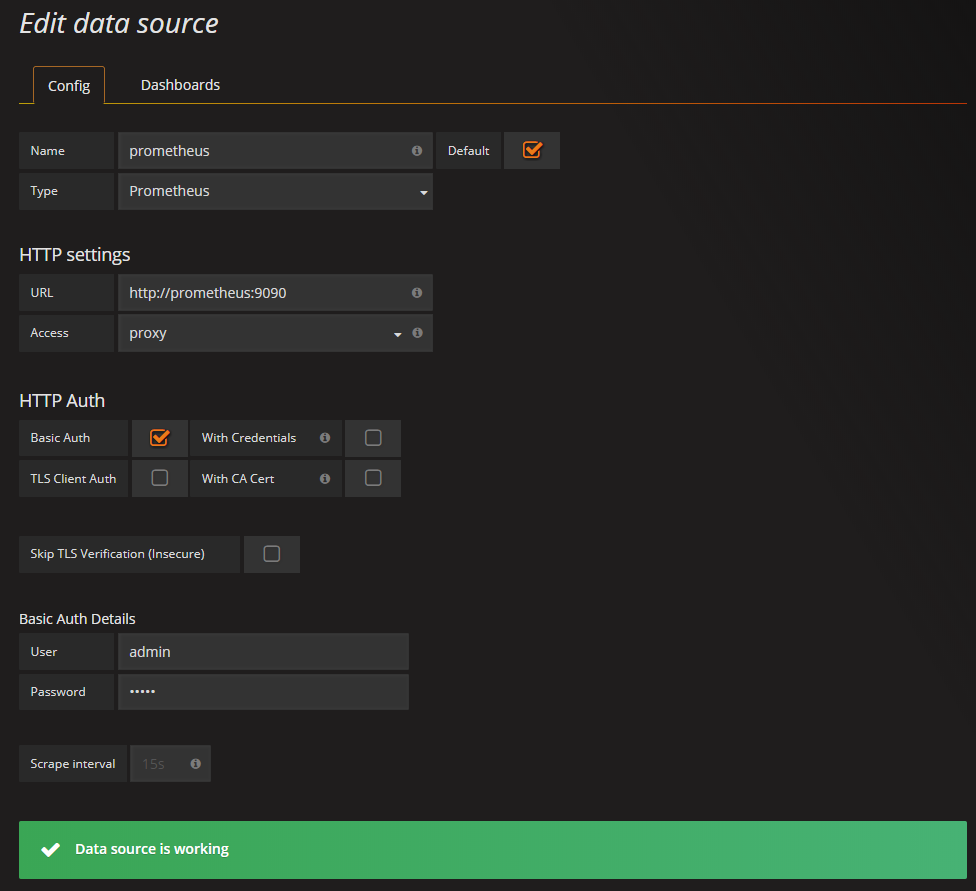
Visit http://DockerIP:3000, use username&password admin to login Grafana. Add datasource, then add a dashboard. Note that this time we don't need to specify the database options.

About Metrics Exporting
Better than InfluxDB, cAdvisor provides 47 metrics for Prometheus. However, I didn't find some similar methods to join multiple metrics by timestamp, because the table format and options are different from InfluxDB templates.
Next we are going to build a small tool based on Prometheus query api, probably the 1st version will be written in Python 3. GitHub link here.
Hi,
Good Day. Could you please help me by providing a way to export the metrics from Promethes in csv format.
Is it possible?
Further, I am using grafana.it has csv option. but, I want to export all the records into csv.
So, please let me know if you have any idea to my problem.
Thanks,
Praveen
Hi Praveen,
Sorry about my late reply. Have you checked this tool (https://github.com/gluckzhang/prometheus2csv) already? Does it meet your requirements?
Best,
Gluck
nice